
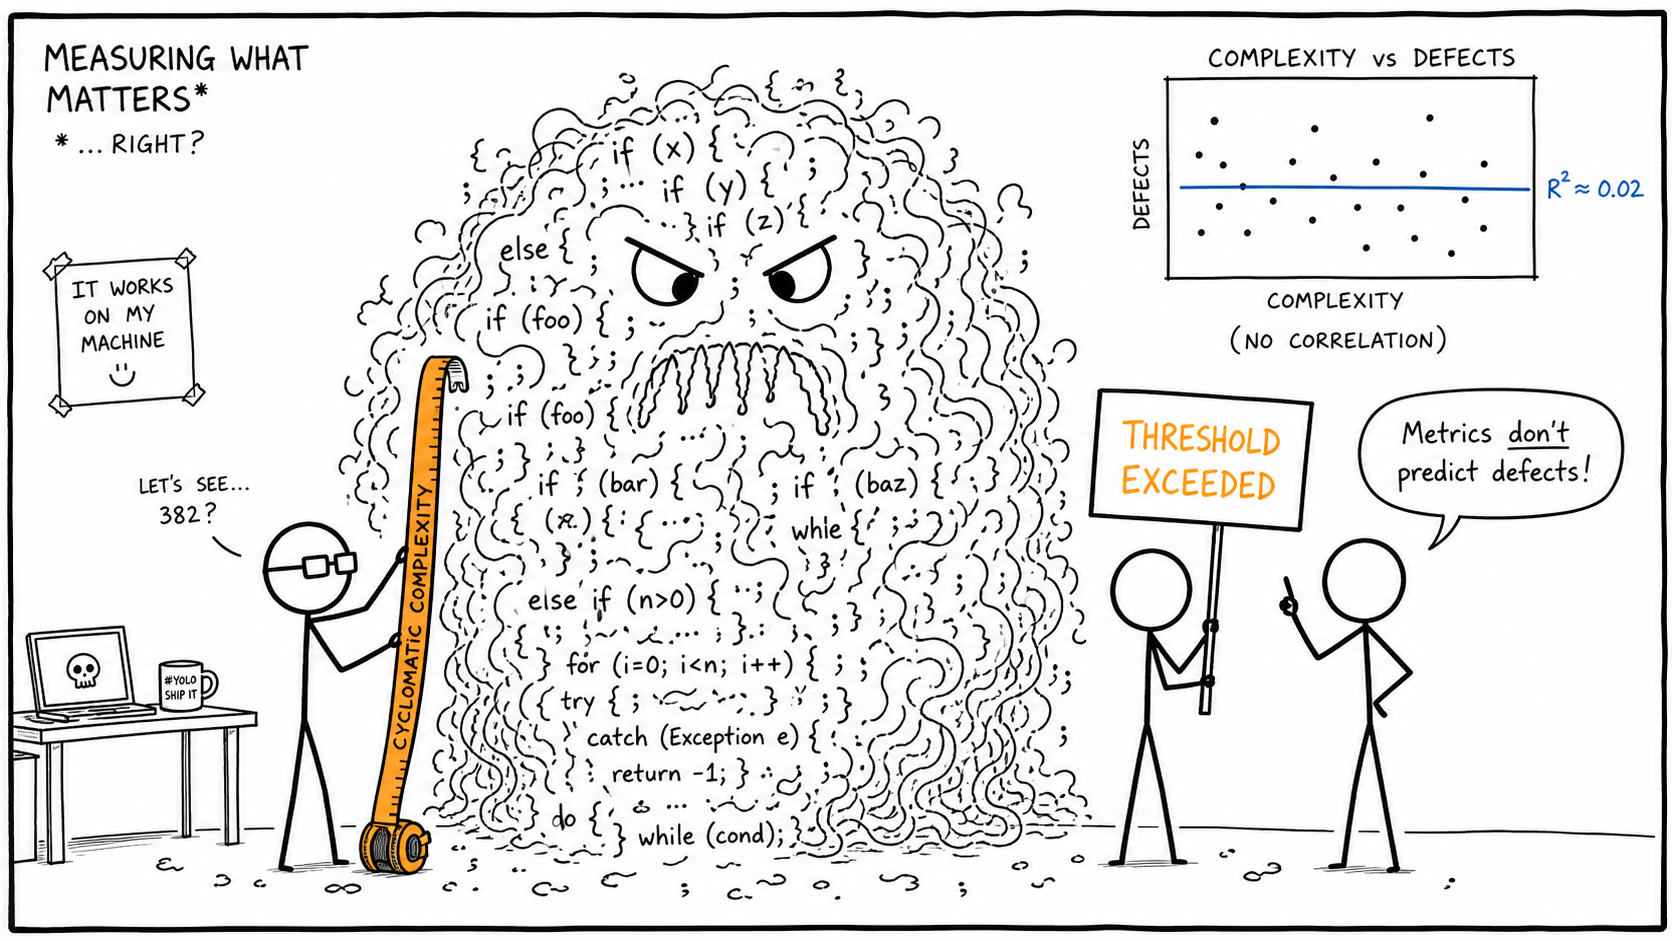
A complex code base is a business risk. By the end of this post, you’ll know which metrics to measure, which thresholds to set, and how to defend them in a review. There are good objections against code metrics, and one of them is surprisingly true: they don’t predict defects. What they predict is effort.
I often see code that “works”, but has rather high complexity metrics. This worries me, since it is one form of technical debt. High complexity makes code difficult to read, hinders future updates, annoys static analyzers as well as humans, and I liked to think it may increase the likelihood of bugs.
On the other hand, metrics should not be a religion. There are no magic numbers, and they may not say much about the software architecture either. Against intuition, they don’t even predict bugs or developer understanding (explanation follows below).
Let’s understand their intention and limitations to make them useful. Starting with…
What is complexity?
I’ll make this short, since concrete metrics and examples will follow below. Taken from one of my favorite books:
“Complexity is anything related to the structure of a software system that makes it hard to understand and modify the system”
When we say structure, we mean:
- function calls
- nesting levels
- branches
- number of lines
- dependencies
- …
What I don’t mean in this article is run-time or memory complexity (that’s for another day).
What I don’t mean either is the pure size of the code (e.g., number of lines). We need to control for that variable, to understand what complexity means.
Why complex code is bad
More complexity makes everything slower, and more exhausting. This is, in a nutshell, the summary of the latest research.
Let’s look into the details from three angles: Humans, tools, and coding agents.
Humans struggle
The bottleneck is working memory. The famous number “7” came from Miller in 1956, saying that humans can only hold 7±2 items in their working memory (although the author cautioned against its interpretation). Nested conditions, live variables and aliases are such items. Even experts do not hold more chunks, they just hold bigger ones, in the form of idioms and patterns. That means the amount of code is not critical, but its structure. If you don’t agree yet, think of a switch-case statement, instead of an if-else-chain – which one is easier to understand?
There is more intuition to gain, if you allow a small detour to neuroscience: A group of researchers put developers in an MRI machine and observed their brains while reading code (I bet that was pleasant for everyone). They found that reading code activates regions for working memory, attention and language, which suggests that code review is closer to reading prose than math. And as we all know, it’s not the length of a sentence that makes a person easy to understand, but rather its internal structure. A few years later, they wanted to see if code complexity metrics correlate with difficulty of comprehension. The result was a very determined “maybe”. Not to generalize, if you ask me – the study was small, and the correlation is underwhelming.
That “maybe” was not the last word, though. Munoz Baron, Wyrich and Wagner collected 10 studies, 427 code snippets and roughly 24,000 human judgements, and ran a meta-analysis over them. They included the more recent cognitive complexity metric, which wants to measure understanding by counting breaks in linear flow, adding a penalty for nesting depth, but no penalty for shorthands like the switch statement. The conclusion: complexity correlates strongly with how long you need to understand a piece of code (r = 0.54), and moderately with how hard it feels while you do it (r = -0.29). But it does not correlate with whether you understand it correctly (r = -0.13).
Read that again, because it is the whole article in one line: complexity tells you what the code will cost you, not whether it can be understood.
To round it off, here is a quick self-test:
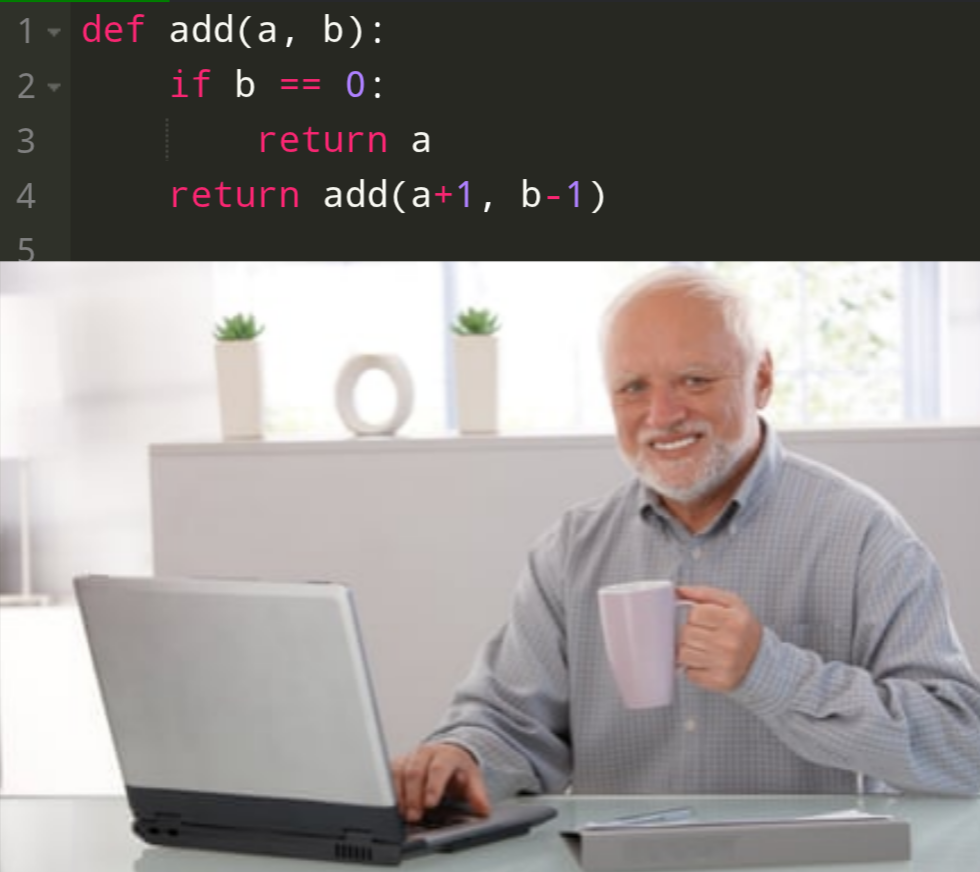
How long did it take you to read that code? Did you understand it? And finally – did you like it? If yes, it’s time to introduce complexity metrics to your workflow.
Complexity metrics predict how long code takes to read. They are not able to predict whether you understand it correctly.
Tooling struggles
This shouldn’t be a surprise to most developers: more complex code equals more tool struggles.
Higher build cost: Compilers have more work on complex code. As an example, header count and include depth drive translation-unit size and rebuild time.
Higher test effort: The more complicated the structure of the code, the more tests are necessary to exercise all cases. And dynamic testing takes time.
Static Analysis is also affected, and this is a well-known connection: more data- and control flows, larger functions and more function calls make the verification question harder. This can result in False Positives, False Negatives, and longer analysis time.
Coding agents struggle
The research is limited, and I won’t draw a parallel to human thinking. Recent data suggests that setting complexity limits for your coding agent can improve the correctness of the generated code. This might be related to chunking again, but in the sense of context window and self-contained interpretation. It also matches what I saw when a static analyzer sits inside the agent’s loop: the generated code gets less bloated.
P.S.: I am not sure yet if coding agents are merely tools. Hence, they got their own section.
When low complexity metrics are mandatory
Perhaps driven by human factors, perhaps by the joys of regulation, we can find references to code metrics in various safety standards. If you are developing code in one of the following domains, you cannot escape them (list not exhaustive):
- Automotive: ISO 26262 Part 6:2018, Table 1 (design and coding principles for units): “restricted size and complexity of software components/functions”, “restricted size of interfaces”, “no recursion”, “one entry / one exit point”, “no unconditional jumps” — mostly
++(highly recommended) across ASIL A–D. The standard names the principle, not the numbers → you define the thresholds in your coding guideline. - Space software: ECSS Q-ST-80C / E-ST-40C: requires a defined metrication programme; complexity is among the reported product metrics.
- Aviation software: DO-178C has no metric mandate, but MC/DC at Level A makes complexity cost money.
- Other safety-related software: IEC 61508 applies and highly recommends “limited size and complexity of software modules/subprograms” for higher safety levels.
Typical metrics
Let’s get more concrete. Here are metrics I see often.
Project-wide
These are mostly there to track the size and trend of the code base.
| Metric | typ. threshold | Why |
|---|---|---|
| Direct recursions | 0 | stack bound provable |
| Recursions (cycles in call graph) | 0 | ditto; also breaks most analyzers |
| Number of files and functions | – | size and trend baseline |
| Number of headers | – | strongly influences compilation time and dependencies |
| Lines and lines of code | – | size and trend baseline |
File-level
They are typically calculated for every translation unit:
| Metric | typ. threshold | Why |
|---|---|---|
| Comment density | ≥ 20 % | enforce presence of doc (not its quality). |
| Lines of code | – | keep files navigable |
| Number of functions/methods | – | keep files navigable |
| Number of headers/includes | – | see above. Typically some files are hotspots. |
Contradictory note: The need for extensive comments can be a red flag that the design isn’t quite right.
Function-level
The most interesting layer:
| Metric | typ. threshold | Why |
|---|---|---|
| Cyclomatic complexity (McCabe) | ≤ 10 | testability, basis-path count |
| Language scope (operator occurrence) | ≤ 4 | cost of maintaining a function |
| Call tree depth | ≤ 4 | stack usage, traceability |
| Calling functions (fan-in) | ≤ 5 | change impact |
| Called functions (fan-out) | ≤ 7 | coupling |
| Number of function parameters | ≤ 5 | interface size |
| Number of gotos | 0 | avoid spaghetti |
| Number of statements/instructions | ≤ 50 | review-sized unit for humans |
| Paths | ≤ 80 | test explosion – even a small function can have billions of paths |
| Number of returns | ≤ 1 | improves error handling, but is contested, since it can increase nesting |
The thresholds shown above are from Hersteller Initiative Software (H.I.S.), an agreement between several OEMs (Kuder, HIS Source Code Metrics 1.3.1, 2008, no longer published). They are not chosen by empirical evidence, but merely agreements. What matters are not the actual numbers, but to have any kind of goal that avoids infinite complexity growth. Thus, feel free to deviate, but set some limits.
Metric thresholds are reasonable, but not a magical upper limit.
That’s a quote from mister McCabe himself, and I agree.
Code Examples
Two short examples to illustrate that having complexity thresholds makes sense.
A bad example (vibe code)
Coding agents love producing lots of code, and they cannot verify their own work. In my experience, they don’t care about us humans, nor about metrics. They just want to please. Here is what it looks like when they go to work without complexity thresholds:
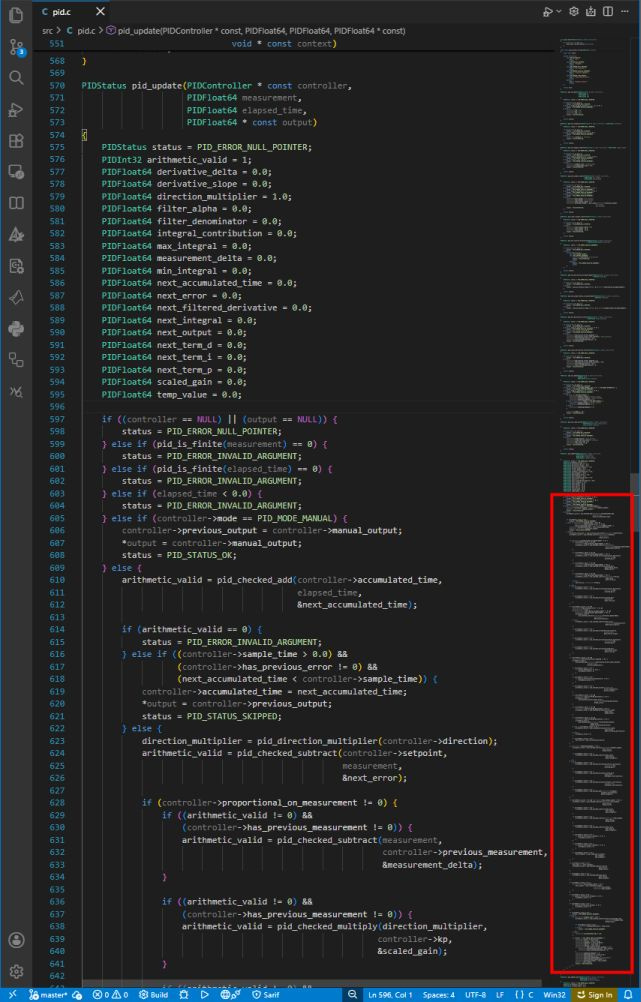
What a display of tabulators, variables and braces this is. Even if this code is correct, nobody wants to read this. By line 20, I have lost track of the surrounding conditionals.
The numbers of this ugly piece of code coming from my coding agent are:
| Metric | Value | Verdict (relation to threshold) |
|---|---|---|
| Number of Params | 4 | OK (80%) |
| Lines in body | 342 | hard fail (684%) |
| Number of Statements | 155 | hard fail (310%) |
| Comment Density | 0 | fail (did you even try?) |
| Cyclomatic Complexity | 59 | hard fail (590%) |
| Language Scope | 15.3 | OK (4%) |
| Number of locals | 21 | almost good (105%) |
| Number of calls | 42 (not a joke) | hard fail (600%) |
| Cognitive Complexity | 72 | hard fail (480%) |
According to that, it’s not a complete disaster, but enough for a full-blown headache.
A good example
The Zephyr project seems to appreciate low complexity. It has low metrics in most critical functions. This should put assessors at ease, and reduce verification effort.
And here is a code sample that is close to the average of the typical metrics in Zephyr:
void *k_heap_aligned_alloc(struct k_heap *heap, size_t align, size_t bytes,
			k_timeout_t timeout)
{
	SYS_PORT_TRACING_OBJ_FUNC_ENTER(k_heap, aligned_alloc, heap, timeout);

	/* A power of 2 as well as 0 is OK */
	__ASSERT((align & (align - 1)) == 0,
		 "align must be a power of 2");

	void *ret = z_heap_alloc_helper(heap, align, bytes, timeout,
					sys_heap_aligned_alloc);

	/*
	 * modules/debug/percepio/TraceRecorder/kernelports/Zephyr/include/tracing_tracerecorder.h
	 * contains a concealed non-parameterized direct reference to a local
	 * variable through the SYS_PORT_TRACING_OBJ_FUNC_EXIT macro below
	 * that is no longer in scope. Provide a dummy stub for compilation
	 * to still succeed until that module's layering violation is fixed.
	 */
	bool blocked_alloc = false; ARG_UNUSED(blocked_alloc);

	SYS_PORT_TRACING_OBJ_FUNC_EXIT(k_heap, aligned_alloc, heap, timeout, ret);

	return ret;
}
The numbers of this essential piece of code are:
| Metric | Value | Verdict (relation to threshold) |
|---|---|---|
| Number of Params | 4 | OK (80%) |
| Lines in body | 21 | OK (62%) |
| Number of Statements | 6 | OK (12%) |
| Comment Density | 29 | OK (145%) |
| Cyclomatic Complexity | 1 | OK (10%) |
| Language Scope | 2.6 | OK (0.7%) |
| Number of locals | 2 | OK (10%) |
| Number of calls | 1 | OK (14%) |
| Cognitive Complexity | 1 | OK (7%) |
Guys, if you are reading this: You probably overdid it, but I totally get it, since it is one of the most dangerous functions.
How to calculate code metrics
There is only one good way to do it.
Use Static Code Analysis
This is the cheapest thing a static code analyzer can do for you. Computing metrics only needs parsing and pure AST/CFG walks. Unlike when we look for defects, we don’t need path exploration, alias analysis, or any kind of solver. It typically takes seconds, where bug finding might take hours.
Since we need to parse, the build configuration must be known. That means we need to know include paths, macros, compiler flags and so on. Missing information results in skipped functions or branches, and hence wrong metrics. This is the #1 reason why numbers differ between tools.
There are a few more caveats where tools are not always comparable, which comes from the way they count (e.g., lines of code, switch, ternaries and exceptions). Hence, as so often with static code analysis tools and fitness trackers: don’t compare the raw numbers, instead focus on the trends.
Don’t ask your coding agent
Just don’t. You are wasting tokens on a hard job for LLMs, with good chances of getting it wrong – for much the same reason that GenAI does not replace Static Analysis when hunting for bugs. While models are good at counting tokens, everything else fails spectacularly (and I don’t even mean the strawberry problem, which is irrelevant here). LLMs don’t parse the code, hence they must painfully match function boundaries, grep the number of braces or indents (depending on your language), and then do some math with it (which honestly, I don’t trust either).
Another shortcoming is lack of build knowledge. To count correctly, at least the build config must be known, which includes macro resolution. That’s nothing an LLM can do out of the box.
Lastly, we want our metrics to be deterministic and not changing when we haven’t touched our code, or when the language model is updated.
Complexity metrics do not predict bugs
This may be surprising, but much like the 100x cost-of-a-bug rule, it is a belief that everybody seems to “know” but few have checked. Here there is plenty of robust data from 25 years of empirical software engineering:
| Study | Data | Finding |
|---|---|---|
| Fenton & Ohlsson, IEEE TSE 2000 | 2 releases of a large commercial telecom system | Size measures were not useful as fault predictors. Faults follow Pareto: a few modules hold most of them. |
| Graves et al., IEEE TSE 2000 | Change history of a large, long-lived system | How often code was changed predicts its faults better than complexity metrics. (Maybe we should never update then?) |
| El Emam et al., IEEE TSE 2001 | 24 metrics, validated against faults | Size is a confounding variable. After controlling for it, only 2 of 24 metrics were useful for bug prediction. Complexity looked predictive mostly because big code has more bugs and more complexity. |
| Nagappan, Ball & Zeller, ICSE 2006 | Post-release defects of 5 Microsoft systems | Complexity metrics can correlate with bugs, but “there is no single set of complexity metrics that could act as a universally best defect predictor”. The predictors are project-specific. |
| Radjenović et al., IST 2013 | Systematic review, 106 studies, 1991–2011 | Confirms that no metric family predicts bugs reliably across projects. |
| Zimmermann, Nagappan & Zeller, 2008 | Survey of bug-prediction approaches | History-based predictors (churn, past fixes, dependencies) work best in practice. |
| Majumder, Mody & Menzies, EMSE 2022 | 722,471 commits from 700 GitHub projects | The largest replication, showing that how the code was changed dominates metrics by a wide margin. |
For fairness, the opposite result exists too: Misra & Bhavsar, ICCSA 2003 looked at 15 design/code measures across 30 projects and reported that most of them have a strong relationship with bug density. But it is a small study that did not control for size.
In general, complexity metrics are blind to side effects of expressions, pointer wars, concurrency aspects, and confusing variable names, which all have a direct link to bugs.
Complexity alone does not predict defects reliably, once we control for size.
Here are two intuitive, practical angles, so you don’t have to memorize the studies for the next conference lunch discussion.
Intuition 1: Code can be generated
If code is generated from a specification (e.g., UML, model-based design), the “optimization settings” of the generator have an obvious impact on what the code looks like, but don’t change the bugs in the output (unless the generator has a bug itself). For example, by “inlining” the same algorithm can have a higher complexity, but the same bug density.
Intuition 2: You can satisfy the metrics but make it worse
Very much in the sense of Goodhart’s Law, metrics become useless when they become a strict target. You can easily lower complexity for the price of higher confusion. For example, move the complex body of a loop to its own function. Yes, function length and cyclomatic complexity fall, but coupling and fan-out rise barely. But most likely, you have created a function that is useless and cannot be tested on its own.
Extended metrics for bug prediction
To improve bug prediction, people have combined complexity metrics with other measurements: how often the code is touched, how many defects static analysis finds in it, and meta-metrics on top.
The ones that actually work are change-based: churn, code age, number of authors, and “hotspots” (high complexity multiplied by high churn) beat static complexity alone as defect predictors. The largest check on that is Majumder, Mody and Menzies (EMSE 2022), who ran both metric families over 722,471 commits from 700 GitHub projects: process metrics reached a median recall of 98 % against 44 % for product metrics.
Rahman and Devanbu (ICSE 2013) explain the mechanism across 85 releases of 12 open-source projects: code metrics barely move between releases, so a model built on them keeps flagging the same large files release after release, even as those files become less defect-dense. Change data moves, so the prediction moves with the code.
And if you want a genuinely different angle, Zimmermann and Nagappan (ICSE 2008) built models from the dependency graph of Windows Server 2003 and beat complexity-based models by 10 percentage points of recall – central components are defect-prone, no matter how tidy they look from the inside. The price for all of this is that you need your VCS history or your architecture, not just the source.
If you want to find the buggy files, look at Static Code Analysis and the change history, not just complexity metrics.
How to (not) reduce complexity
By now, you should have a good idea what results in low complexity, and that it is valuable to do it, even if it may not reduce bugs. Unfortunately, “have fewer than X functions in your file” is not a good mental guideline when architecting your code. Here are a few more abstract pointers:
- modularize – this creates fewer dependencies
- encapsulate – this reduces data flows and hence complexity
- separate concerns – results in smaller pieces
- make it simple & obvious!
Here are counter-indications for reducing complexity:
- Retroactive, metric-driven refactoring of working, field-proven safety code injects regression risk for no functional gain.
- Splitting or extracting code into helper functions that are useless on their own (e.g., deeply nested loop bodies).
- Contradicts clarity: E.g., exhaustive
switchover an enum, table-driven parsers, defensive input validation all raise complexity, while lowering risk. - Generated code: Hand-tuning it for metrics is wasted work – the next generation overwrites it. Fix the model, not the C file.
If you cannot reasonably eliminate complexity, then here is the next best thing: Isolate complexity to a place where it will rarely be seen. A place that is rarely touched by any developer is a good choice, since complexity only hits when code has to be changed. In a crude mathematical way (stolen from A Philosophy of Software Design again):
Where p are the parts of the system, c_p the complexity of each part, and t_p the time developers spend on that part.
This, however, needs t_p, which cannot be determined from just one code snapshot. Either you have to analyze the history of the code base, or you ask the most senior developer that you can find (typically recognizable by ponytail or long beard).
Summary
Complexity does not correlate with bugs, but with development effort. This is true in all aspects – humans, analysis tools, and coding agents all benefit from lower complexity. The easiest way to lower complexity is to run a static code analyzer while coding, and to set thresholds for your project. Don’t sweat the numbers, just use them as guidance. The reward is easier software maintenance, which saves time and cost. And, as always with Static Code Analysis, you will find more bugs, too.